Porta-Graph
Software
for Windows TM
Recording
Visualizing
Analyzing
Documentation
|
|
Porta-Graph
Visualizing Analyzing Documentation |
| Description and Application |
The program Porta-Graph is a comfortable standard measuring data processing system for all Micronics Ltd. measuring devices. Comfortable tools enable the user to easily define his measuring tasks, control the measuring and the evaluation processes, and enable an impressive documentation of the results. This program runs in WINDOWS 3.1, WINDOWS 95/98 and WINDOWS NT. |
|
General Features Standard Version
Presentation
Measuring Operation |
Menu-guiding full-graphic user interface, toolbar Online-help for each function Program and help text in German / English / French, shiftable without program restart Y/t-measurement value presentation with individual adjustable zoom range Measuring value lists online visualization with min. max. and mean value Easy definition of measuring channels through selection windows 16 line colors and 16 line types, up to 3 Y-axes at the same time Global and diagram oriented measuring value list, absolute/relative time axis Statistic diagram with min. max. and mean value for every measurement series Digital display for online visualization Data transfer from/to measuring device via RS232-interface Automatic recognition of devices and sensors Free to set measuring cycles for the measurement and for the presentation in a diagram Automatic execution control of a measurement, ON- and OFFLINE-operation Measuring values, configurations and diagram settings may be saved Data export for further processing in ASCII, Excel-Format Print preview on screen Copyfunction to windows clipboard Documentation of diagrams, measuring value lists, protocol of the measurement setup with user comment |
|
|
|
| Additional Features Premium Version |
X/Y-measurment value presentation column display for online visualization Formula channels, online and offline, visualization in Y/t, X/Y,display, column and measuring value list Measuring values through mathematical formula combinable whatever desired Formula data bank Up to 100 formula channels Monitoring of limiting value violations, sensor rupture, PC-soundcard alarm Joining different measurement series, partial measurement may be saved Predefined options available, customer specific development available upon request |
Channel Table:
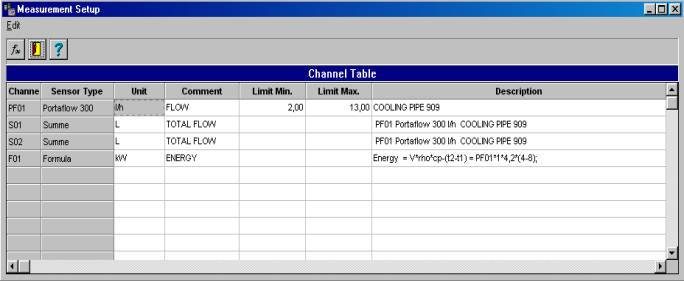
The program makes a consecutive query to the connected measuring devices and sensors and transfers the data into the channel table
Depending on program version, up to 300 measuring channels may be connected
Up to 100 formula channels
may be defined additionally. Formula channels will be immediately calculated
and shown during ONLINE-measurement.
You may however enter the formula for calculation after successful measurement.
The list of units is extendable.
Limiting values and descriptions may be added to every measuring channel in the table.
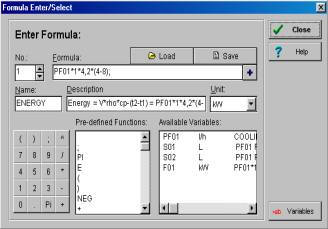
Formula Editor:
|
The measurement channels may be combined together to result in any formula. User defined formulas may be added and loaded anytime. In the formula entry, common mathematical functions like basic operations, sine, cosine, ln, log etc are available. The formula functions may be automatically entered in the channel table by clicking the mouse. Databank for Variables |
|
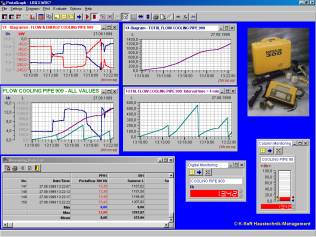
General View:
|
In the general view, 32 different diagrams may be displayed together. A maximum of 3 Y-axes may be plotted. The axes scalation may be choosen as desired. Diagram title, line colors and line types may be modified individually. Limiting value violations in digital and column diagram are indicated through change of color. Important diagram related functions are available via buttons in the toolbar, ex.: -Start/stop measuring -Auto scale X- and Y- axes -Arrange diagrams, entire screen view -Print preview |
|
Overview and zoom range:
|
The overview diagram at the upper part of the screen shows the complete measurement period The highlightened measurement data segment above is shown in the zoom window below. The legend shows detailed informations like name, sensor type, dimension and text description for every measuring value The current measuring value located at the measurement data line will be displayed in the legend. Limiting value violations are red (maximum value) or blue (minimun value). Legends and overview diagram may be switched ON/OFF. |
 |
Documentation:
|
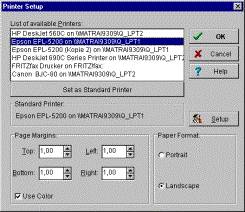
For documentation, all Windows standard output possibilities like printer and plotter are available. The use of colors is optional. Diagrams, measuring value lists and measurement setup protocol may be printed. Different measurement series may be joined and printed together. Partial measurements may be saved as separate files. Measurement value lists may be saved in ASCII or Excel format for further processing. The measuring data may be automatically saved as daily-, weekly-, or monthly files in the standard formats during the measurement.
|
 |
|
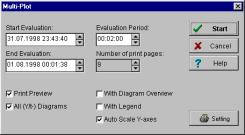
The option ãMulti-PlotÒ allows to print several pages of Y/t diagram automatically from a saved measurement The program determines the number of pages to be printed from the evaluation period and time. Overview diagram, legends etc. may be printed. |
 |
| Functions
of Porta-Graph: |
PG-S |
PG-P |
|
||||
|
Program
operation |
|
|
|
||||
|
Menu-guiding user
interface, toolbar |
X |
X |
|
||||
|
Online-help for each
function |
X |
X |
|
||||
|
Text in German /
English / French, shiftable |
X |
X |
|
||||
|
Presentation |
|
|
|
||||
|
Y/t-diagram, zoom
function, overview diagram, legend |
X |
X |
|
||||
|
X/Y-diagramm, zoom
function, legend |
|
X |
|
||||
|
Statistic diagram,
min., max., mean value f. every measurement series |
X |
X |
|
||||
|
Digital display |
X |
X |
|
||||
|
column display, limiting
value monitoring |
|
X |
|
||||
|
Measurement value
lists, absolute/relative time axes |
X |
X |
|
||||
|
Measurement-configuration/-operation |
|
|
|
||||
|
Automatic reading
of VELOCICALC ® Plus devices and sensor data |
X |
X |
|
||||
|
Reading device memory,
deleting after OFFLINE-operation |
X |
X |
|
||||
|
25 formula channels
online and offline |
|
X |
|
||||
|
100 formula channels
online and offline |
|
Upon
request |
|
||||
|
Automatic execution
control |
X |
X |
|
||||
|
Evaluation
/ Documentation |
|
|
|
||||
|
Measurement channels
may be combined via mathematical formula |
|
X |
|
||||
|
Formula data bank |
|
X |
|
||||
|
Saving measurement
values, configuration |
X |
X |
|
||||
|
Joining different
measurement series |
|
X |
|
||||
|
Saving partial measurements |
|
X |
|
||||
|
Data export in standard-ASCII
and Excel-format |
X |
X |
|
||||
|
Print preview on
screen |
X |
X |
|
||||
|
Documentation diagrams,
measurement value list, measurement setup |
X |
X |
|
||||
|
Options |
|
|
|
||||
|
Mean values in interval
& floating (OP-MWSUM) |
|
|
|
||||
|
Summation for a measurement
channel (OP-MWSUM) |
|
|
|
||||
|
Multiplot for printouts
of Y/t-Diagrams (OP-MPT) |
|
|
|
||||
|
|
|
|
|||||
|
Visualization of
equipment and process schemes |
Upon
request |
|
|||||
Adaption for other measuring devices |
Upon
request |
|
|||||
|
|
|
|
|||||
|
System
requirements: |
|
||||||
|
Recommended
configuration: |
Minimum
configuration: |
||||||
|
Computer: |
Intel
pentium 133 MHz, min. 16 MB RAM |
Computer: |
80486,
33 MHz, min. 8 MB RAM |
||||
|
Operating
system: |
WINDOWS
3.1, WINDOWS 95, WINDOWS NT |
Operating
system: |
WINDOWS
3.1 |
||||
|
Hard
disk space: |
Min.
4 MB for program, 4 MB free for data |
Hard
disk space: |
Min.
4 MB for program, 4 MB free for data |
||||
|
Hardware: |
PC-mouse,
1 free serial comport RS232, EGA/VGA color graphic card, disk drive 3,5 |
Hardware: |
PC-mouse,
1 free serial comport RS232, EGA/VGA color graphic card, disk drive 3,5 |
||||
|
|
|
||||||
|
Program
versions Porta-Graph: |
Prices |
||||||
|
Order
number |
Description |
Valid until end of 2000 |
|||||
|
|
|
Won |
|||||
|
PG-S
(Standard Version) |
Porta-Graph Standard, limited functions |
1,500,000 |
|||||
|
PG-P
(Premium Version) |
Porta-Graph Premium, |
2,200,000 |
|||||
|
OP-MPT
|
Option
multi-plot |
300,000 |
|||||
|
OP-MWSUM |
Option
mean value and sum calculation |
230,000 |
|||||
|
|||||||